How Our Premium Optimizer Picks Which Puts to Sell
27 July 2026 · 9 min read
Most option-selling tools score one trade at a time: this put has a good annualised return, that one has better liquidity, this strike sits at a comfortable delta. That's useful for picking a contract, and useless for the question that actually decides whether a book survives: what happens to all of it at once, in a bad week.
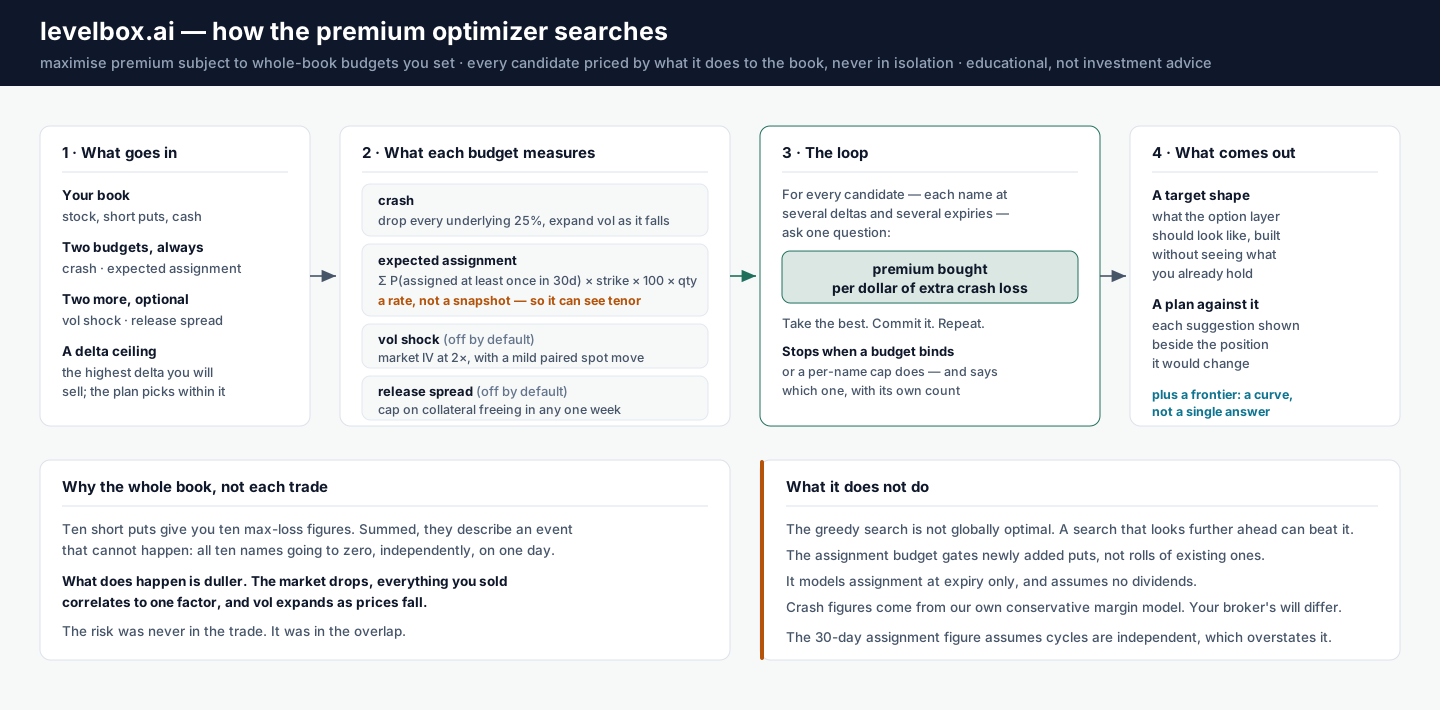
The premium optimizer answers the second question. It takes your portfolio and the risk budgets you set, then searches the option chain for the allocation that collects the most premium without breaching either budget, the best set of trades rather than the single best trade, scored against the whole book.
The problem with per-trade risk
Sell ten cash-secured puts and your broker will happily show you ten max-loss figures. Add them up and you get a number that describes an event which can't happen: all ten names going to zero, independently, on the same day.
What actually happens is duller: the market drops 25%, everything you sold correlates to roughly one factor, implied volatility expands as prices fall, and the margin on your short puts inflates at exactly the moment your equity is worth least. None of that shows up in a per-trade max loss, because the risk was always in the overlap between positions, not any single trade.
So the optimizer never scores a trade in isolation. Every candidate is priced by what it does to the book's stressed net liquidation value.
The budgets
The crash budget caps modelled net-liq loss at a reference drawdown, 25% by default. The stress applies the drop to every underlying, expands volatility as it falls, and re-prices every leg, then asks how much of your net liquidation value is left. You give it a ceiling, say 20%, and the optimizer won't hand you an allocation that models worse than that.
The assignment budget caps something the crash number misses entirely: how much stock you should expect to be handed. For each short put it computes the probability of assignment, the real one rather than delta, multiplies by strike times 100 times contracts, and sums across the book, expressed as a percentage of NAV.
That figure is now measured over thirty days rather than as an instantaneous snapshot, which matters more than it sounds: a snapshot cannot tell a weekly book from a monthly one. Why the budget had to be put on the same clock as the premium is its own story, and the short version is that the number moves several-fold on a short-dated book.
This budget replaced an earlier one that looked reasonable and wasn't. The old version capped blended delta: the average absolute delta across your contracts. But an average over contract count is blind to size. A thirty-name book at 0.10 delta and a three-name book at 0.10 delta scored identically, when the second is obviously the more concentrated bet. Summing dollars instead of averaging deltas caps delta and notional jointly, and it binds much harder on concentrated books. If you've been running a small number of large positions, expect this budget to constrain you where the old one never did.
There are two further budgets, both off by default: a volatility-shock budget (covered in portfolio vega) and a release-concentration cap that limits how much collateral may free in any single week.
The assignment budget only gates newly added puts. When the optimizer rolls an existing threatened put, that roll isn't checked against the budget, because changing a strike changes assignment exposure in a way the greedy allocator doesn't re-derive. The assignment figure reported in the output describes the book you ran the tool on, not the book you'll hold after executing the plan.
How it searches
The core loop is greedy. At each step it evaluates every candidate — each eligible name at several target deltas and several expiries — and asks one question: how much premium does this contract buy per dollar of additional crash loss? It takes the best, commits it, and repeats, until a budget binds, a per-name cap binds, or it runs out of contracts worth adding. Ranking by that ratio is the classic greedy rule for a knapsack problem, which is what allocating capital across contracts turns out to be.
Naively that's slow, because scoring one candidate means re-stressing the entire book, and there are thousands of candidates per pass. So the crash model is incremental: it carries a running net-liq-now and net-liq-at-reference-drawdown and updates them leg by leg, rather than re-stressing everything each time. It's parity-checked against the full calculation, so the fast path and the slow path agree.
Greedy isn't globally optimal; a search that looks further ahead can beat it. How far short it falls is unmeasured, and measuring it would mean solving the exact problem the heuristic exists to avoid. What the greedy loop buys instead is speed: it stays fast enough to sweep a whole frontier.
How it picks names
Before anything is scored, hard gates remove names outright:
- anything on your exclusion list
- anything you already hold, so the optimizer doesn't double down on your existing concentration
- names with too little price history to measure correlation honestly
- leveraged instruments
- names flagged as re-rating where the price action agrees — specifically, below the 200-day
- names the liquidity screen has never seen
That re-rating gate is deliberately conservative. The label fires on growth decelerating from a high base, and in roughly two-thirds of real cases the price action contradicts it. So a label the tape hasn't confirmed doesn't exclude the name; it applies a soft penalty in scoring instead.
What survives gets a diversification score, a product of four factors: how much the name diversifies your existing book, how much it diversifies what has already been picked in this run, its quality score, and that soft penalty. Because the second factor exists, the ranking is recomputed after every pick: choosing one semiconductor name pushes the next one down. A negatively correlated name scores above the midpoint and is actively rewarded.
Where a correlation can't be measured, too little overlap or a flat series, it's treated as neutral rather than good or bad. We'd rather a name with no evidence sit mid-pack than have missing data push it to the top.
The frontier is the point
The single most useful output is the curve, not the plan.
The optimizer runs the entire allocation at six different crash budgets, from half your stated budget to about 1.3 times it, and reports the maximum premium reachable at each. That turns an unanswerable question ("am I taking too much risk?") into a legible trade: this much more crash tolerance buys that much more monthly income, measured as yield on capital rather than yield on premium.
Sometimes the curve is flat, and that's the most informative result available. A flat frontier means more risk tolerance buys nothing, because something else is binding. We ran exactly this on a real book recently: re-pricing it at four different strike deltas moved premium from $22.5k to $55.0k a month, moved expected assignment from 16.2% to 30.4% of NAV, and left the modelled crash loss at 49.3% on every single rung.
On a book whose notional is already committed, the strike delta barely changes the crash outcome, because in a 25% bear those puts are in the money whether you sold 0.15 or 0.27. Delta wasn't buying crash risk. It was buying premium and costing assignment. Assignment is a cash constraint, not a risk-appetite one. The binding limit turned out to be the cash available to absorb being handed stock, which isn't a number most option sellers track at all.
Only sweeping the frontier, and noticing what doesn't move, shows you that.
The curve also has a shape worth reading. On the books we have measured it has a knee: below it a point of crash budget buys a lot of premium, above it very little. The optimizer now reports where that knee sits on your frontier, and whether the rung you picked is past it, alongside the plan's premium as a share of NAV — because a monthly premium figure is not legible as a return until NAV sits beside it.
Plan mode vs. redeploy mode
Plan mode de-risks first, then adds income. It trims equity holdings above their concentration cap down to the cap, leaves short puts alone, and only then allocates new premium. This is the calm-market stance: the book is toppy or over-concentrated, and freeing capacity before adding exposure is the right order.
Redeploy mode never trims. It defends threatened existing puts by rolling them, then deploys sidelined cash into new positions at a wider delta band, bounded by a deploy-capital pool (a configurable fraction of cash above a reserve floor you set). This is the correction stance: vol is rich, prices have settled, and the job is putting cash to work rather than reducing.
The distinction matters because the same book wants opposite actions depending on where you are in the cycle, and a tool with one mode will quietly give you the wrong one half the time.
What it doesn't do
It doesn't know your tax position, your job, or how you sleep, which is why a slow goal needs a coach and not just a dashboard. It doesn't model early assignment, only assignment at expiry. It doesn't have dividend data, so it assumes none, which slightly understates assignment odds on payers. Its crash figures come from our own conservative margin model, not your broker's, and the two won't match. The assignment probability it uses is the risk-neutral one, a price-implied quantity rather than a forecast of what will happen.
The optimizer won't tell you what to do. What it does is turn a vague worry, is this book too risky for what it pays me?, into numbers you set yourself, a search that respects them, and a curve showing what relaxing them would actually buy. That's a clearer way to look at the same book than a screenshot of annualised returns.
Analytical and educational tooling, not investment advice. Crash and margin figures are model estimates from our own conservative TIMS-lite margin model, not your broker's numbers, and assignment probabilities are risk-neutral rather than statistical forecasts. Options carry the risk of assignment and of loss; size positions accordingly and decide for yourself.
Common questions
- What does the premium optimizer actually optimise?
- It maximises the total premium you collect across the whole book, subject to hard budgets you set: a crash budget and an assignment budget always, plus an optional volatility-shock budget and a release-concentration cap. The crash budget caps how much modelled net liquidation value you lose in a reference bear market, which defaults to a 25% drop. The assignment budget caps the summed dollars of stock you should expect to be handed, computed as the probability of assignment times strike times 100 times contracts, summed across every short put, expressed as a percentage of NAV and measured over a thirty-day window rather than as an instantaneous snapshot. It searches strikes, expiries and contract counts across the option chain and stops adding when a budget binds.
- Why budget the whole portfolio instead of each trade's max loss?
- Because per-trade max loss adds up to a number that never happens. Ten uncorrelated puts hitting max loss simultaneously isn't a scenario; ten correlated puts falling together in one bad week is. A whole-book stress asks what happens to your net liquidation value when the market drops 25% at once, with volatility expanding as it falls. That's the number that decides whether you survive to keep selling, and it isn't the sum of the per-trade numbers.
- How does it decide which name to sell a put on next?
- In two stages. First, hard gates remove names outright: anything you have excluded, anything you already hold, anything with too little price history to measure correlation, leveraged instruments, and names the liquidity screen has never seen. Then it scores what survives on a product of four factors: how much the name diversifies your existing book, how much it diversifies what has already been picked in this run, its quality score, and a soft penalty for a re-rating the price action hasn't confirmed. It re-scores after every pick, so choosing one name changes the ranking of the next.
- What is the efficient frontier the optimizer shows?
- It runs the whole allocation at six different crash budgets, from half your stated budget up to about 1.3 times it, and reports the maximum premium reachable at each. That gives you a curve rather than a single answer: you can see what an extra five points of crash tolerance actually buys in monthly income. 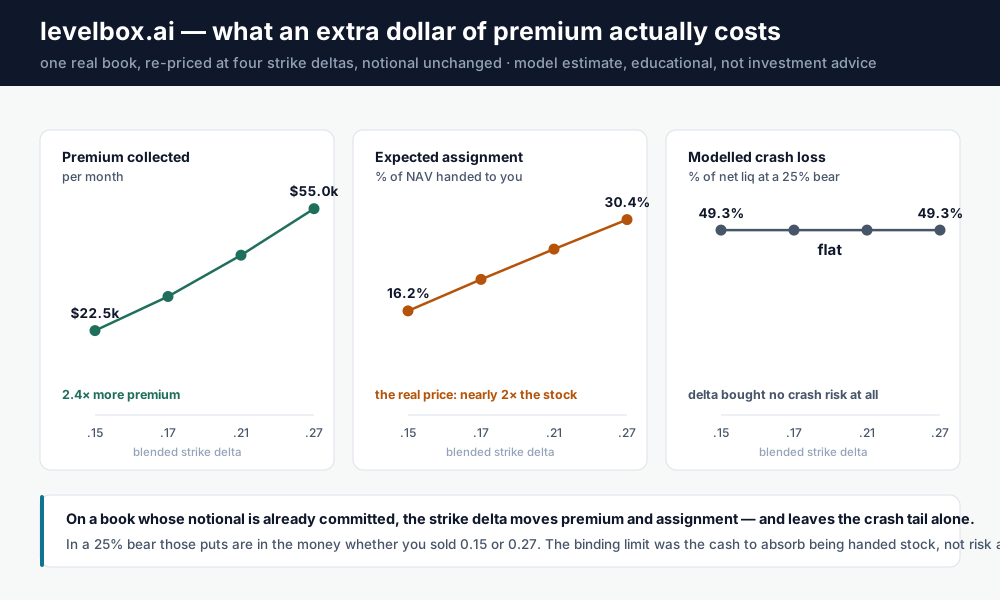 Sometimes the curve is flat, which means more risk tolerance buys you nothing because a different constraint is binding. That's usually the most useful thing on the screen.
- Is the optimizer's output a recommendation to trade?
- No. It's a modelled allocation under stated assumptions, and both the crash figures and the assignment probabilities are model estimates rather than a broker's numbers. Our crash stress uses our own conservative TIMS-lite margin model with volatility expanding into the drawdown, which won't match your broker's margin engine. Assignment probability is the risk-neutral figure, which isn't the same as a statistical forecast. Treat the output as a structured way to compare choices, not as instructions.
Read next
- General Option Selling
Monthly Returns From Selling Options: Why 2–3% of NAV Is the Realistic Ceiling
Quoting 5% a month on collateral is easy. Keeping 2–3% of NAV is not, and it would put you ahead of every listed premium-selling fund. Where the premium comes from, where it leaks, what the constraint buys you, and the book composition that holds it together.
- General Option Selling
If You Measure Premium Monthly, Measure Risk Monthly Too
A weekly put and a monthly put at the same delta look identical on most risk numbers. One of them runs ten times a month. Here is the mismatch that hides, and what it does to a book.
- General Option Selling
Option Vega and Portfolio Vega: What Premium Sellers Are Really Short
Vega is the Greek most option sellers glance at and move on from. It grows as the trade goes against you, it barely diversifies across a book, and it prices the risk you are actually being paid to take.